

2026 Rocket Launch Statistics
As of 19 November 2026, there have been 270 orbital launch attempts worldwide in 2026, and 262 of them reached orbit. That is 8 fewer than by the same date in 2025, which ended with 329 launches, the most of any year. SpaceX flew 127 of them (47%); by country, the United States launched 157 and China 82. Together they have put 2,302 tonnes of payload in orbit so far.
Statistics summary
Rockets launched
2026 so far
270
vs 278 by this date in 2025
Last 7 days
5
vs 6.2 weekly avg. over 365 days
Payload to orbit
2026 so far
2,302 t
vs 2,511 t by this date in 2025
Last 7 days
57 t
vs 51.2 t weekly avg. over 365 days
Reached orbit
2026 so far
97%
262 of 270; 7 failures, 1 partial
All of 2025
96%
316 of 329; 12 failures, 1 partial
Who's flying in 2026
 SpaceX127vs 15347%Fri 20 Nov · Falcon 9 Block 5
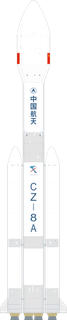
 CASC55vs 5420%Fri 20 Nov · Long March 8A
- Rocket Lab19vs 147%NET Nov 2026 · Electron
 Progress RSC13vs 105%Tue 24 Nov · Soyuz 2.1b
- CAS Space7vs 43%None scheduled
- ULA6vs 52%Thu 14 Jan · Atlas V N22








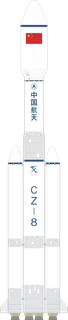












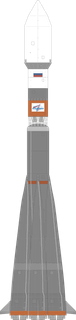
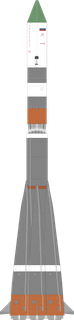
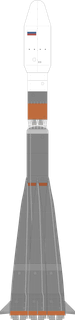
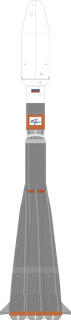
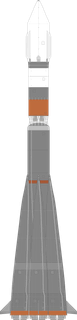
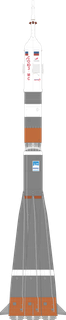





2026 so far against the same date in 2025. Drawings at one true scale; the paler ones are on the schedule.
- United States157vs 17658%Fri 20 Nov · Falcon 9 Block 5
- China82vs 7330%Fri 20 Nov · Long March 8A
- Russia15vs 136%Tue 24 Nov · Soyuz 2.1b
 France4vs 31%Mon 23 Nov · Ariane 64 Block 2
 Japan4vs 31%NET Dec 2026 · H3-22
 India4vs 41%NET Nov 2026 · Launch Vehicle Mark-3 (GSLV Mk III)




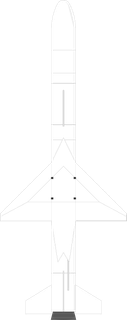






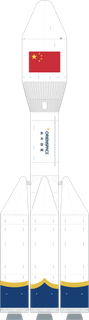





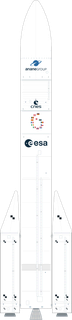








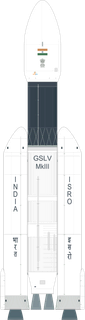

2026 so far against the same date in 2025. Drawings at one true scale; the paler ones are on the schedule.
Every company, as a table
| Company | Launches | Share | Payload to orbit | Share |
|---|---|---|---|---|
| SpaceX | 127 | 47% | 1,787 t | 78% |
| CASC | 55 | 20% | 217 t | 9% |
| Rocket Lab | 19 | 7% | 3 t | <1% |
| Progress RSC | 13 | 5% | 72 t | 3% |
| CAS Space | 7 | 3% | 15 t | 1% |
| ULA | 6 | 2% | 70 t | 3% |
| Galactic Energy | 5 | 2% | 2 t | <1% |
| LandSpace | 5 | 2% | 12 t | 1% |
| ArianeGroup | 4 | 1% | 56 t | 2% |
| China Rocket | 4 | 1% | 6 t | <1% |
| ExPace | 3 | 1% | 2 t | <1% |
| ISRO | 3 | 1% | 5 t | <1% |
| Mitsubishi Heavy Industries | 3 | 1% | 11 t | <1% |
| Avio | 2 | 1% | 4 t | <1% |
| Khrunichev | 2 | 1% | 3 t | <1% |
| Orienspace | 2 | 1% | 3 t | <1% |
| Blue Origin | 1 | <1% | 6 t | <1% |
| Boeing / Northrop Grumman / Aerojet Rocketdyne / ULA | 1 | <1% | 26 t | 1% |
| Firefly | 1 | <1% | 1 t | <1% |
| Isar Aerospace | 1 | <1% | 30 kg | <1% |
| KAI / Hanwha Aerospace | 1 | <1% | 1 t | <1% |
| Orbital ATK | 1 | <1% | 500 kg | <1% |
| Orbital Sciences | 1 | <1% | 430 kg | <1% |
| Skyroot Aerospace | 1 | <1% | 5 kg | <1% |
| Space One | 1 | <1% | – | |
| Space Pioneer | 1 | <1% | – |
Launches and payload by week

Orbital launch attempts per week, the past 12 months
SpaceX, and the rest of the world by region.
Show as table
| Week of | SpaceX | Rest of US | Europe | China | Russia | India | Rest of World | All | Payload to orbit |
|---|---|---|---|---|---|---|---|---|---|
| 15 Nov 2026 | – | 1 | – | 1 | – | – | – | 2 | 2 t |
| 8 Nov 2026 | 2 | 1 | – | 2 | 1 | – | – | 6 | 74 t |
| 1 Nov 2026 | 1 | 1 | – | 3 | 1 | – | – | 6 | 30 t |
| 25 Oct 2026 | 2 | – | – | 1 | – | 1 | – | 4 | 39 t |
| 18 Oct 2026 | 2 | 1 | – | 3 | – | – | 1 | 7 | 29 t |
| 11 Oct 2026 | 3 | – | – | 1 | – | – | – | 4 | 48 t |
| 4 Oct 2026 | 1 | – | – | 1 | – | – | 1 | 3 | 18 t |
| 27 Sep 2026 | 4 | – | – | – | – | – | – | 4 | 75 t |
| 20 Sep 2026 | 2 | 1 | – | 3 | – | – | – | 6 | 42 t |
| 13 Sep 2026 | 2 | 1 | 1 | 5 | 2 | – | – | 11 | 45 t |
| 6 Sep 2026 | 2 | 1 | – | 1 | – | – | – | 4 | 34 t |
| 30 Aug 2026 | 2 | 1 | 1 | 1 | – | 1 | – | 6 | 28 t |
| 23 Aug 2026 | 2 | – | 1 | 1 | 1 | – | – | 5 | 42 t |
| 16 Aug 2026 | 5 | 1 | – | 3 | – | – | – | 9 | 73 t |
| 9 Aug 2026 | 2 | – | – | 1 | – | – | 1 | 4 | 35 t |
| 2 Aug 2026 | 3 | 1 | – | 2 | – | – | – | 6 | 53 t |
| 26 Jul 2026 | 2 | – | – | 2 | – | – | – | 4 | 26 t |
| 19 Jul 2026 | 4 | – | – | 3 | 1 | – | – | 8 | 45 t |
| 12 Jul 2026 | 3 | – | – | – | 1 | 1 | – | 5 | 55 t |
| 5 Jul 2026 | 4 | – | – | 2 | – | – | – | 6 | 68 t |
| 28 Jun 2026 | 3 | 2 | – | 2 | – | – | – | 7 | 59 t |
| 21 Jun 2026 | 3 | 1 | – | 1 | – | – | – | 5 | 35 t |
| 14 Jun 2026 | 3 | 1 | 1 | 4 | – | – | – | 9 | 74 t |
| 7 Jun 2026 | 4 | 1 | – | 2 | – | – | 1 | 8 | 78 t |
| 31 May 2026 | 2 | – | – | 3 | – | – | – | 5 | 44 t |
| 24 May 2026 | 4 | 1 | – | 3 | – | – | – | 8 | 95 t |
| 17 May 2026 | 3 | 1 | 1 | 1 | – | – | – | 6 | 39 t |
| 10 May 2026 | 2 | – | – | 4 | – | – | – | 6 | 60 t |
| 3 May 2026 | 2 | – | – | – | – | – | – | 2 | 19 t |
| 26 Apr 2026 | 4 | 1 | 1 | – | – | – | – | 6 | 84 t |
| 19 Apr 2026 | 3 | 2 | – | 2 | 2 | – | – | 9 | 51 t |
| 12 Apr 2026 | 2 | – | – | 2 | 1 | – | – | 5 | 41 t |
| 5 Apr 2026 | 3 | 1 | – | 3 | – | – | – | 7 | 53 t |
| 29 Mar 2026 | 3 | 2 | – | 2 | 1 | – | – | 8 | 88 t |
| 22 Mar 2026 | 2 | 1 | – | 3 | 2 | – | – | 8 | 48 t |
| 15 Mar 2026 | 4 | 1 | – | 2 | – | – | – | 7 | 65 t |
| 8 Mar 2026 | 4 | 1 | – | 2 | – | – | – | 7 | 61 t |
| 1 Mar 2026 | 3 | 1 | – | – | – | – | 1 | 5 | 48 t |
| 22 Feb 2026 | 4 | – | – | – | – | – | – | 4 | 64 t |
| 15 Feb 2026 | 4 | – | – | – | – | – | – | 4 | 62 t |
| 8 Feb 2026 | 2 | 1 | 1 | 1 | 1 | – | – | 6 | 48 t |
| 1 Feb 2026 | 2 | – | – | 1 | 1 | – | – | 4 | 41 t |
| 25 Jan 2026 | 4 | 1 | – | 1 | – | – | – | 6 | 52 t |
| 18 Jan 2026 | 2 | 1 | – | 1 | – | – | – | 4 | 33 t |
| 11 Jan 2026 | 4 | – | – | 6 | – | 1 | – | 11 | 64 t |
| 4 Jan 2026 | 2 | – | – | – | – | – | – | 2 | 33 t |
| 28 Dec 2025 | 1 | – | – | 2 | 1 | – | – | 4 | 13 t |
| 21 Dec 2025 | – | 1 | – | 3 | 1 | 1 | 2 | 8 | 22 t |
| 14 Dec 2025 | 4 | 3 | 1 | 2 | – | – | – | 10 | 95 t |
| 7 Dec 2025 | 5 | – | – | 6 | – | – | – | 11 | 83 t |
| 30 Nov 2025 | 4 | – | 1 | 4 | – | – | – | 9 | 79 t |
| 23 Nov 2025 | 2 | – | – | 1 | 2 | – | 1 | 6 | 39 t |
| 16 Nov 2025 | 2 | 1 | – | 1 | – | – | – | 4 | 38 t |
Year against year
Orbital launch attempts, year against year, 2023 to 2026
Added up through each year.
Show as table
| By the end of | 2023 | 2024 | 2025 | 2026 |
|---|---|---|---|---|
| January | 16 · 79 t | 22 · 170 t | 22 · 201 t | 24 · 185 t |
| February | 28 · 179 t | 41 · 301 t | 42 · 406 t | 42 · 399 t |
| March | 53 · 312 t | 63 · 497 t | 68 · 573 t | 72 · 648 t |
| April | 65 · 367 t | 82 · 675 t | 94 · 845 t | 103 · 921 t |
| May | 85 · 525 t | 108 · 893 t | 123 · 1,112 t | 126 · 1,151 t |
| June | 98 · 628 t | 126 · 1,066 t | 148 · 1,358 t | 155 · 1,403 t |
| July | 116 · 745 t | 139 · 1,166 t | 172 · 1,566 t | 182 · 1,621 t |
| August | 138 · 890 t | 160 · 1,345 t | 201 · 1,799 t | 208 · 1,848 t |
| September | 161 · 1,063 t | 183 · 1,481 t | 232 · 2,079 t | 235 · 2,039 t |
| October | 178 · 1,222 t | 203 · 1,653 t | 258 · 2,368 t | 256 · 2,196 t |
| November | 194 · 1,368 t | 233 · 1,920 t | 289 · 2,593 t | 270 · 2,302 t |
| December | 223 · 1,522 t | 263 · 2,098 t | 329 · 2,877 t |
Busiest rockets in 2026
- Falcon 9 Block 5120 launchesno failures

- Electron19 launchesno failures

- Long March 6A9 launchesno failures

- Long March 2D7 launchesno failures

- Long March 126 launchesno failures

- Long March 8A6 launchesno failures
- Kinetica 15 launchesno failures

- Atlas V 5514 launchesno failures

Launches and payload by country in 2026
Orbital launch attempts by country, 2026 so far
By the country of the rocket.
Show as table
| Country | Launches | Share | Payload to orbit | Share |
|---|---|---|---|---|
| United States | 157 | 58% | 1,893 t | 82% |
| China | 82 | 30% | 257 t | 11% |
| Russia | 15 | 6% | 76 t | 3% |
| France | 4 | 1% | 56 t | 2% |
| India | 4 | 1% | 5 t | <1% |
| Japan | 4 | 1% | 11 t | <1% |
| Italy | 2 | 1% | 4 t | <1% |
| Germany | 1 | <1% | 30 kg | <1% |
| South Korea | 1 | <1% | 1 t | <1% |