

2001 Rocket Launch Statistics
In 2001, there were 59 orbital launch attempts worldwide, and 56 of them reached orbit. That is 26 fewer than in 2000. By country, the United States launched 22 and Russia 21. Together they put 360 tonnes of payload in orbit.
Statistics summary
Payload to orbit
2001
360 t
vs 414 t in 2000
Per week
7 t
vs 8 t in 2000
Reached orbit
2001
95%
56 of 59; 1 failure, 2 partial
2000
95%
81 of 85; 4 failures
Who flew in 2001
Company2001 launches2001Share
 Progress RSC11vs 1319%
 Lockheed Martin8vs 1114%
 Yuzhmash6vs 710%
- Khrunichev6vs 1510%
 Aérospatiale6vs 810%
- Rockwell / Martin Marietta / Thiokol6vs 510%
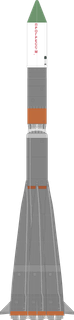
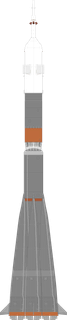
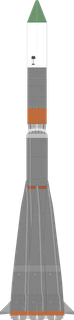
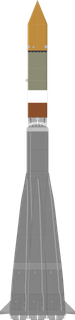
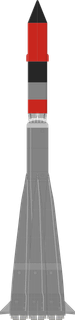
















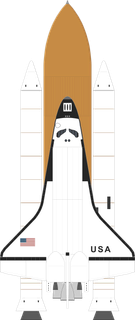
2001 against 2000. Drawings at one true scale.
Country2001 launches2001Share








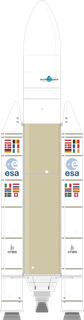





2001 against 2000. Drawings at one true scale.
Every company, as a table
| Company | Launches | Share | Payload to orbit | Share |
|---|---|---|---|---|
| Progress RSC | 11 | 19% | 79 t | 22% |
| Lockheed Martin | 8 | 14% | 32 t | 9% |
| Aérospatiale | 6 | 10% | 26 t | 7% |
| Khrunichev | 6 | 10% | 24 t | 7% |
| Rockwell / Martin Marietta / Thiokol | 6 | 10% | 152 t | 42% |
| Yuzhmash | 6 | 10% | 19 t | 5% |
| ULA | 5 | 8% | 7 t | 2% |
| ArianeGroup | 2 | 3% | 10 t | 3% |
| ISRO | 2 | 3% | 3 t | 1% |
| McDonnell Douglas | 2 | 3% | 2 t | <1% |
| CASC | 1 | 2% | 8 t | 2% |
| Mitsubishi Heavy Industries | 1 | 2% | 86 kg | <1% |
| Moscow Institute of Thermal Technology | 1 | 2% | 250 kg | <1% |
| Orbital Sciences | 1 | 2% | – | |
| Polyot | 1 | 2% | 800 kg | <1% |
Launches and payload by week

Orbital launch attempts per week, 2001
SpaceX, and the rest of the world by region.
Show as table
| Week of | SpaceX | Rest of US | Europe | China | Russia | India | Rest of World | All | Payload to orbit |
|---|---|---|---|---|---|---|---|---|---|
| 23 Dec 2001 | – | – | – | – | 1 | – | – | 1 | 1 t |
| 16 Dec 2001 | – | – | – | – | 1 | – | – | 1 | 3 t |
| 9 Dec 2001 | – | – | – | – | 1 | – | – | 1 | 3 t |
| 2 Dec 2001 | – | 2 | – | – | – | – | – | 2 | 29 t |
| 25 Nov 2001 | – | – | 1 | – | 2 | – | – | 3 | 19 t |
| 21 Oct 2001 | – | – | – | – | 2 | 1 | – | 3 | 11 t |
| 14 Oct 2001 | – | 1 | – | – | – | – | – | 1 | 1 t |
| 7 Oct 2001 | – | 1 | – | – | – | – | – | 1 | 4 t |
| 30 Sep 2001 | – | 2 | – | – | 1 | – | – | 3 | 18 t |
| 23 Sep 2001 | – | – | 1 | – | – | – | – | 1 | 3 t |
| 16 Sep 2001 | – | 1 | – | – | – | – | – | 1 | – |
| 9 Sep 2001 | – | – | – | – | 1 | – | – | 1 | 8 t |
| 2 Sep 2001 | – | 1 | – | – | – | – | – | 1 | 2 t |
| 26 Aug 2001 | – | – | 1 | – | – | – | 1 | 2 | 5 t |
| 19 Aug 2001 | – | – | – | – | 2 | – | – | 2 | 13 t |
| 5 Aug 2001 | – | 3 | – | – | – | – | – | 3 | 31 t |
| 29 Jul 2001 | – | – | – | – | 1 | – | – | 1 | 2 t |
| 22 Jul 2001 | – | 1 | – | – | – | – | – | 1 | 2 t |
| 15 Jul 2001 | – | – | – | – | 1 | – | – | 1 | 2 t |
| 8 Jul 2001 | – | 1 | 1 | – | – | – | – | 2 | 26 t |
| 24 Jun 2001 | – | 1 | – | – | – | – | – | 1 | 840 kg |
| 17 Jun 2001 | – | 1 | – | – | – | – | – | 1 | 3 t |
| 10 Jun 2001 | – | – | – | – | 1 | – | – | 1 | 4 t |
| 3 Jun 2001 | – | – | 1 | – | 1 | – | – | 2 | 6 t |
| 27 May 2001 | – | – | – | – | 1 | – | – | 1 | 7 t |
| 20 May 2001 | – | – | – | – | 1 | – | – | 1 | 10 t |
| 13 May 2001 | – | 1 | – | – | 1 | – | – | 2 | 6 t |
| 6 May 2001 | – | – | – | – | 1 | – | – | 1 | 5 t |
| 22 Apr 2001 | – | – | – | – | 1 | – | – | 1 | 7 t |
| 15 Apr 2001 | – | 1 | – | – | – | 1 | – | 2 | 26 t |
| 1 Apr 2001 | – | 1 | – | – | 1 | – | – | 2 | 4 t |
| 18 Mar 2001 | – | – | – | – | 1 | – | – | 1 | 5 t |
| 4 Mar 2001 | – | 1 | 1 | – | – | – | – | 2 | 27 t |
| 25 Feb 2001 | – | 1 | – | – | 1 | – | – | 2 | 14 t |
| 18 Feb 2001 | – | – | – | – | 1 | – | – | 1 | 250 kg |
| 4 Feb 2001 | – | 1 | 1 | – | – | – | – | 2 | 34 t |
| 28 Jan 2001 | – | 1 | – | – | – | – | – | 1 | 2 t |
| 21 Jan 2001 | – | – | – | – | 1 | – | – | 1 | 7 t |
| 7 Jan 2001 | – | – | 1 | 1 | – | – | – | 2 | 11 t |
Year against year
Orbital launch attempts, year against year, 1998 to 2001
Added up through each year.
Show as table
| By the end of | 1998 | 1999 | 2000 | 2001 |
|---|---|---|---|---|
| January | 6 · 32 t | 2 · 986 kg | 4 · 9 t | 4 · 21 t |
| February | 15 · 59 t | 10 · 28 t | 13 · 50 t | 9 · 68 t |
| March | 20 · 80 t | 14 · 39 t | 19 · 63 t | 12 · 100 t |
| April | 26 · 123 t | 24 · 59 t | 23 · 87 t | 17 · 137 t |
| May | 34 · 154 t | 31 · 98 t | 30 · 127 t | 22 · 165 t |
| June | 40 · 193 t | 36 · 109 t | 37 · 144 t | 27 · 178 t |
| July | 46 · 205 t | 43 · 161 t | 45 · 180 t | 32 · 211 t |
| August | 54 · 222 t | 47 · 173 t | 51 · 212 t | 39 · 259 t |
| September | 59 · 232 t | 56 · 206 t | 60 · 273 t | 44 · 272 t |
| October | 69 · 287 t | 62 · 219 t | 72 · 340 t | 51 · 304 t |
| November | 73 · 316 t | 67 · 236 t | 79 · 368 t | 53 · 319 t |
| December | 82 · 362 t | 78 · 266 t | 85 · 414 t | 59 · 360 t |
Busiest rockets in 2001
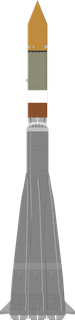
Launches and payload by country in 2001
Orbital launch attempts by country, 2001
By the country of the rocket.