

Space Services Inc. Launch Tracker
As of 22 October 2026, Space Services Inc. has flown 0 of the 249 orbital launch attempts in 2026, 0% of the world's launches, and 1 since its first in 1995. Its latest launches and the next ones on the schedule, drawn to scale.
Latest mission
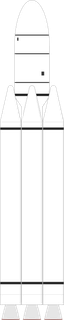
Planetary Science
Conestoga 1620
Oct 23, 1995
Conestoga 1620's maiden flight, the first orbital launch from NASA Wallops in a decade, broke apart 46 seconds after liftoff when guidance-system noise triggered unnecessary steering corrections. The METEOR/COMET-1 microgravity payload with 14 experiments was destroyed, later bankrupting builder EER Systems.
Next mission
Drawing unavailable
No upcoming mission scheduled.
Statistics summary
Space Services Inc. launches
2026 so far
0
vs 0 by this date in 2025
Last 7 days
0
vs 0.0 weekly avg. over 365 days
Payload to orbit
2026 so far
0 t
vs 0 t by this date in 2025
Last 7 days
0 t
vs 0.0 t weekly avg. over 365 days

Past launches

Every Space Services Inc. launch scheduled for the next seven days, in UTC.
No Space Services Inc. launch is scheduled in the next seven days.
Space Services Inc. in 2026
Space Services Inc. orbital launches per month, 2026 so far
- 0Jan
- 0Feb
- 0Mar
- 0Apr
- 0May
- 0Jun
- 0Jul
- 0Aug
- 0Sep
- 0Oct
- Nov
- Dec
Show as table
| Month | Space Services Inc. |
|---|---|
| January | 0 |
| February | 0 |
| March | 0 |
| April | 0 |
| May | 0 |
| June | 0 |
| July | 0 |
| August | 0 |
| September | 0 |
| October | 0 |
Orbital launch attempts added up, Space Services Inc. and the rest of the world, 2026 so far
Day by day since 1 January.
Show as table
| By the end of | Space Services Inc. | Rest of world |
|---|---|---|
| January | 0 | 24 |
| February | 0 | 42 |
| March | 0 | 72 |
| April | 0 | 103 |
| May | 0 | 126 |
| June | 0 | 155 |
| July | 0 | 182 |
| August | 0 | 208 |
| September | 0 | 235 |
| October | 0 | 249 |
Orbital launch attempts per week, Space Services Inc. and the rest of the world, the past 12 months
Show as table
| Week of | Space Services Inc. | Rest of world |
|---|---|---|
| 18 Oct 2026 | 0 | 4 |
| 11 Oct 2026 | 0 | 4 |
| 4 Oct 2026 | 0 | 3 |
| 27 Sep 2026 | 0 | 4 |
| 20 Sep 2026 | 0 | 6 |
| 13 Sep 2026 | 0 | 11 |
| 6 Sep 2026 | 0 | 4 |
| 30 Aug 2026 | 0 | 6 |
| 23 Aug 2026 | 0 | 5 |
| 16 Aug 2026 | 0 | 9 |
| 9 Aug 2026 | 0 | 4 |
| 2 Aug 2026 | 0 | 6 |
| 26 Jul 2026 | 0 | 4 |
| 19 Jul 2026 | 0 | 8 |
| 12 Jul 2026 | 0 | 5 |
| 5 Jul 2026 | 0 | 6 |
| 28 Jun 2026 | 0 | 7 |
| 21 Jun 2026 | 0 | 5 |
| 14 Jun 2026 | 0 | 9 |
| 7 Jun 2026 | 0 | 8 |
| 31 May 2026 | 0 | 5 |
| 24 May 2026 | 0 | 8 |
| 17 May 2026 | 0 | 6 |
| 10 May 2026 | 0 | 6 |
| 3 May 2026 | 0 | 2 |
| 26 Apr 2026 | 0 | 6 |
| 19 Apr 2026 | 0 | 9 |
| 12 Apr 2026 | 0 | 5 |
| 5 Apr 2026 | 0 | 7 |
| 29 Mar 2026 | 0 | 8 |
| 22 Mar 2026 | 0 | 8 |
| 15 Mar 2026 | 0 | 7 |
| 8 Mar 2026 | 0 | 7 |
| 1 Mar 2026 | 0 | 5 |
| 22 Feb 2026 | 0 | 4 |
| 15 Feb 2026 | 0 | 4 |
| 8 Feb 2026 | 0 | 6 |
| 1 Feb 2026 | 0 | 4 |
| 25 Jan 2026 | 0 | 6 |
| 18 Jan 2026 | 0 | 4 |
| 11 Jan 2026 | 0 | 11 |
| 4 Jan 2026 | 0 | 2 |
| 28 Dec 2025 | 0 | 4 |
| 21 Dec 2025 | 0 | 8 |
| 14 Dec 2025 | 0 | 10 |
| 7 Dec 2025 | 0 | 11 |
| 30 Nov 2025 | 0 | 9 |
| 23 Nov 2025 | 0 | 6 |
| 16 Nov 2025 | 0 | 7 |
| 9 Nov 2025 | 0 | 9 |
| 2 Nov 2025 | 0 | 8 |
| 26 Oct 2025 | 0 | 7 |
| 19 Oct 2025 | 0 | 3 |
Payload delivered to orbit by Space Services Inc., year against year, 2023 to 2026
Tonnes, added up through each year.
Show as table
| By the end of | 2023 | 2024 | 2025 | 2026 |
|---|---|---|---|---|
| January | 0 · 0 t | 0 · 0 t | 0 · 0 t | 0 · 0 t |
| February | 0 · 0 t | 0 · 0 t | 0 · 0 t | 0 · 0 t |
| March | 0 · 0 t | 0 · 0 t | 0 · 0 t | 0 · 0 t |
| April | 0 · 0 t | 0 · 0 t | 0 · 0 t | 0 · 0 t |
| May | 0 · 0 t | 0 · 0 t | 0 · 0 t | 0 · 0 t |
| June | 0 · 0 t | 0 · 0 t | 0 · 0 t | 0 · 0 t |
| July | 0 · 0 t | 0 · 0 t | 0 · 0 t | 0 · 0 t |
| August | 0 · 0 t | 0 · 0 t | 0 · 0 t | 0 · 0 t |
| September | 0 · 0 t | 0 · 0 t | 0 · 0 t | 0 · 0 t |
| October | 0 · 0 t | 0 · 0 t | 0 · 0 t | 0 · 0 t |
| November | 0 · 0 t | 0 · 0 t | 0 · 0 t | |
| December | 0 · 0 t | 0 · 0 t | 0 · 0 t |
The record
- Share in 2026
- 0%
- so far
- Launches in 2026
- 0
- of 249 worldwide
- Share in 2025
- 0%
- 0 launches
- All time
- 1
- since 1995
Orbital launch attempts per year, Space Services Inc. and the rest of the world, 1995 to today
2026 so far, as of 22 October 2026.
Show as table
| Year | Space Services Inc. | Rest of world | Space Services Inc. payload | Rest of world payload |
|---|---|---|---|---|
| 2026 (so far) | 0 | 249 | – | 2,163 t |
| 2025 | 0 | 329 | – | 2,877 t |
| 2024 | 0 | 263 | – | 2,098 t |
| 2023 | 0 | 223 | – | 1,522 t |
| 2022 | 0 | 186 | – | 1,108 t |
| 2021 | 0 | 146 | – | 835 t |
| 2020 | 0 | 114 | – | 601 t |
| 2019 | 0 | 102 | – | 438 t |
| 2018 | 0 | 114 | – | 413 t |
| 2017 | 0 | 90 | – | 410 t |
| 2016 | 0 | 85 | – | 363 t |
| 2015 | 0 | 87 | – | 377 t |
| 2014 | 0 | 92 | – | 369 t |
| 2013 | 0 | 81 | – | 364 t |
| 2012 | 0 | 78 | – | 390 t |
| 2011 | 0 | 84 | – | 429 t |
| 2010 | 0 | 74 | – | 387 t |
| 2009 | 0 | 78 | – | 429 t |
| 2008 | 0 | 69 | – | 386 t |
| 2007 | 0 | 68 | – | 321 t |
| 2006 | 0 | 66 | – | 315 t |
| 2005 | 0 | 56 | – | 254 t |
| 2004 | 0 | 54 | – | 195 t |
| 2003 | 0 | 63 | – | 199 t |
| 2002 | 0 | 65 | – | 347 t |
| 2001 | 0 | 59 | – | 360 t |
| 2000 | 0 | 85 | – | 414 t |
| 1999 | 0 | 78 | – | 266 t |
| 1998 | 0 | 82 | – | 362 t |
| 1997 | 0 | 89 | – | 416 t |
| 1996 | 0 | 77 | – | 344 t |
| 1995 | 1 | 79 | – | 388 t |
Launch success rate by Space Services Inc. rocket, 1995 to today
Test flights are left out; partial failures count as failures.
Show as table
| Rocket | Launches | Successful | Failed or partial | Success rate |
|---|---|---|---|---|
| Conestoga 1620 | 1 | 0 | 1 | 0% |
Every year
| Year | Space Services Inc. | World | Space Services Inc. share | Payload to orbit | Share of payload |
|---|---|---|---|---|---|
| 2026 (so far) | 0 | 249 | 0% | – | |
| 2025 | 0 | 329 | 0% | – | |
| 2024 | 0 | 263 | 0% | – | |
| 2023 | 0 | 223 | 0% | – | |
| 2022 | 0 | 186 | 0% | – | |
| 2021 | 0 | 146 | 0% | – | |
| 2020 | 0 | 114 | 0% | – | |
| 2019 | 0 | 102 | 0% | – | |
| 2018 | 0 | 114 | 0% | – | |
| 2017 | 0 | 90 | 0% | – | |
| 2016 | 0 | 85 | 0% | – | |
| 2015 | 0 | 87 | 0% | – | |
| 2014 | 0 | 92 | 0% | – | |
| 2013 | 0 | 81 | 0% | – | |
| 2012 | 0 | 78 | 0% | – | |
| 2011 | 0 | 84 | 0% | – | |
| 2010 | 0 | 74 | 0% | – | |
| 2009 | 0 | 78 | 0% | – | |
| 2008 | 0 | 69 | 0% | – | |
| 2007 | 0 | 68 | 0% | – | |
| 2006 | 0 | 66 | 0% | – | |
| 2005 | 0 | 56 | 0% | – | |
| 2004 | 0 | 54 | 0% | – | |
| 2003 | 0 | 63 | 0% | – | |
| 2002 | 0 | 65 | 0% | – | |
| 2001 | 0 | 59 | 0% | – | |
| 2000 | 0 | 85 | 0% | – | |
| 1999 | 0 | 78 | 0% | – | |
| 1998 | 0 | 82 | 0% | – | |
| 1997 | 0 | 89 | 0% | – | |
| 1996 | 0 | 77 | 0% | – | |
| 1995 | 1 | 80 | 1% | – |