

2023 Rocket Launch Statistics
In 2023, there were 223 orbital launch attempts worldwide, and 211 of them reached orbit. That is 37 more than in 2022, and the most of any year until then. SpaceX flew 98 of them (44%); by country, the United States launched 116 and China 67. Together they put 1,522 tonnes of payload in orbit.
Statistics summary
Payload to orbit
2023
1,522 t
vs 1,108 t in 2022
Per week
29 t
vs 21 t in 2022
Reached orbit
2023
95%
211 of 223; 11 failures, 1 partial
2022
96%
179 of 186; 7 failures
Who flew in 2023
Company2023 launches2023Share
 SpaceX98vs 6144%
 CASC47vs 5321%
 Progress RSC17vs 198%
- Rocket Lab9vs 94%
 ISRO7vs 53%
- Galactic Energy7vs 23%























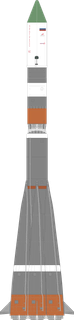
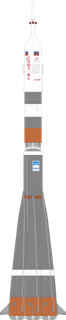
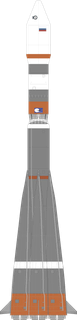

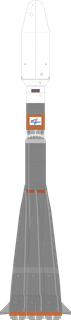
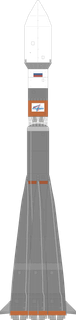
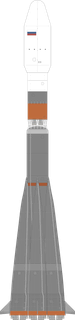



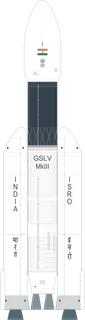





2023 against 2022. Drawings at one true scale.
Country2023 launches2023Share



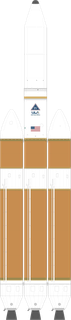


















2023 against 2022. Drawings at one true scale.
Every company, as a table
| Company | Launches | Share | Payload to orbit | Share |
|---|---|---|---|---|
| SpaceX | 98 | 44% | 1,242 t | 82% |
| CASC | 47 | 21% | 134 t | 9% |
| Progress RSC | 17 | 8% | 78 t | 5% |
| Rocket Lab | 9 | 4% | 851 kg | <1% |
| Galactic Energy | 7 | 3% | 1 t | <1% |
| ISRO | 7 | 3% | 14 t | 1% |
| ExPace | 6 | 3% | 1 t | <1% |
| Mitsubishi Heavy Industries | 3 | 1% | 6 t | <1% |
| National Aerospace Technology Administration | 3 | 1% | 200 kg | <1% |
| ULA | 3 | 1% | 10 t | 1% |
| ArianeGroup | 2 | 1% | 13 t | 1% |
| Firefly | 2 | 1% | 350 kg | <1% |
| i-Space | 2 | 1% | 310 kg | <1% |
| IRGC Aerospace Force | 2 | 1% | 15 kg | <1% |
| Khrunichev | 2 | 1% | 5 t | <1% |
| LandSpace | 2 | 1% | 200 kg | <1% |
| Agency for Defense Development | 1 | <1% | 80 kg | <1% |
| Avio | 1 | <1% | 783 kg | <1% |
| CAS Space | 1 | <1% | 1 t | <1% |
| China Rocket | 1 | <1% | 300 kg | <1% |
| Israel Aerospace Industries | 1 | <1% | 300 kg | <1% |
| KAI / Hanwha Aerospace | 1 | <1% | 236 kg | <1% |
| Long Wall | 1 | <1% | – | |
| Northrop Grumman | 1 | <1% | 12 t | 1% |
| Relativity | 1 | <1% | – | |
| Space Pioneer | 1 | <1% | 108 kg | <1% |
| Virgin Orbit | 1 | <1% | – |
Launches and payload by week

Orbital launch attempts per week, 2023
SpaceX, and the rest of the world by region.
Show as table
| Week of | SpaceX | Rest of US | Europe | China | Russia | India | Rest of World | All | Payload to orbit |
|---|---|---|---|---|---|---|---|---|---|
| 24 Dec 2023 | 3 | – | – | 5 | 1 | – | – | 9 | 30 t |
| 17 Dec 2023 | 2 | 1 | – | 1 | 1 | – | – | 5 | 39 t |
| 10 Dec 2023 | – | 1 | – | 3 | 1 | – | – | 5 | 24 t |
| 3 Dec 2023 | 3 | – | – | 4 | – | – | 1 | 8 | 52 t |
| 26 Nov 2023 | 2 | – | – | – | 1 | – | – | 3 | 27 t |
| 19 Nov 2023 | 2 | – | – | 1 | 1 | – | 1 | 5 | 41 t |
| 12 Nov 2023 | 3 | – | – | 1 | – | – | – | 4 | 22 t |
| 5 Nov 2023 | 3 | – | – | 1 | – | – | – | 4 | 44 t |
| 29 Oct 2023 | 3 | – | – | 2 | – | – | – | 5 | 58 t |
| 22 Oct 2023 | 1 | – | – | 2 | 1 | – | – | 4 | 35 t |
| 15 Oct 2023 | 2 | – | – | 1 | – | – | – | 3 | 33 t |
| 8 Oct 2023 | 3 | – | 1 | – | – | – | – | 4 | 36 t |
| 1 Oct 2023 | 1 | 1 | – | 1 | – | – | – | 3 | 19 t |
| 24 Sep 2023 | 3 | – | – | 1 | – | – | 1 | 5 | 50 t |
| 17 Sep 2023 | 1 | 1 | – | 2 | – | – | – | 4 | 18 t |
| 10 Sep 2023 | 2 | 2 | – | 1 | 1 | – | – | 6 | 45 t |
| 3 Sep 2023 | 2 | – | – | 2 | – | – | 1 | 5 | 38 t |
| 27 Aug 2023 | 3 | – | – | 1 | – | 1 | – | 5 | 41 t |
| 20 Aug 2023 | 2 | 1 | – | 2 | 1 | – | 1 | 7 | 40 t |
| 13 Aug 2023 | 1 | – | – | 1 | – | – | – | 2 | 17 t |
| 6 Aug 2023 | 3 | – | – | 3 | 2 | – | – | 8 | 52 t |
| 30 Jul 2023 | 1 | 1 | – | 1 | – | 1 | – | 4 | 20 t |
| 23 Jul 2023 | 3 | – | – | 2 | – | – | – | 5 | 44 t |
| 16 Jul 2023 | 2 | 1 | – | 2 | – | – | – | 5 | 28 t |
| 9 Jul 2023 | 1 | – | – | 2 | – | 1 | – | 4 | 21 t |
| 2 Jul 2023 | 1 | – | 1 | – | – | – | – | 2 | 22 t |
| 25 Jun 2023 | 1 | – | – | – | 1 | – | – | 2 | 5 t |
| 18 Jun 2023 | 3 | 1 | – | 1 | – | – | – | 5 | 41 t |
| 11 Jun 2023 | 2 | – | – | 1 | – | – | – | 3 | 22 t |
| 4 Jun 2023 | 2 | – | – | 2 | – | – | – | 4 | 37 t |
| 28 May 2023 | 1 | – | – | 1 | – | 1 | 1 | 4 | 28 t |
| 21 May 2023 | 2 | 1 | – | 1 | 2 | – | 1 | 7 | 27 t |
| 14 May 2023 | 3 | – | – | 1 | – | – | – | 4 | 43 t |
| 7 May 2023 | 1 | 1 | – | 1 | – | – | – | 3 | 35 t |
| 30 Apr 2023 | 2 | – | – | – | – | – | – | 2 | 24 t |
| 23 Apr 2023 | 2 | – | – | – | – | – | – | 2 | 17 t |
| 16 Apr 2023 | 2 | – | – | 1 | – | 1 | – | 4 | 19 t |
| 9 Apr 2023 | 1 | – | 1 | – | – | – | – | 2 | 9 t |
| 2 Apr 2023 | 2 | – | – | 2 | – | – | – | 4 | 10 t |
| 26 Mar 2023 | 1 | – | – | 2 | 1 | 1 | 1 | 6 | 25 t |
| 19 Mar 2023 | 1 | 2 | – | 1 | 1 | – | – | 5 | 21 t |
| 12 Mar 2023 | 3 | 1 | – | 3 | 1 | – | – | 8 | 49 t |
| 5 Mar 2023 | 1 | – | – | 1 | – | – | 1 | 3 | 8 t |
| 26 Feb 2023 | 3 | – | – | – | – | – | 1 | 4 | 45 t |
| 19 Feb 2023 | – | – | – | 2 | 1 | – | – | 3 | 13 t |
| 12 Feb 2023 | 3 | – | – | – | – | – | – | 3 | 38 t |
| 5 Feb 2023 | 1 | – | – | – | 2 | 1 | – | 4 | 17 t |
| 29 Jan 2023 | 2 | – | – | – | – | – | – | 2 | 32 t |
| 22 Jan 2023 | 1 | 1 | – | – | – | – | 1 | 3 | 19 t |
| 15 Jan 2023 | 3 | – | – | 1 | – | – | – | 4 | 25 t |
| 8 Jan 2023 | 1 | 2 | – | 4 | – | – | – | 7 | 17 t |
| 1 Jan 2023 | 1 | – | – | – | – | – | – | 1 | 4 t |
Year against year
Orbital launch attempts, year against year, 2020 to 2023
Added up through each year.
Show as table
| By the end of | 2020 | 2021 | 2022 | 2023 |
|---|---|---|---|---|
| January | 7 · 45 t | 7 · 31 t | 8 · 40 t | 16 · 79 t |
| February | 16 · 94 t | 17 · 100 t | 21 · 130 t | 28 · 179 t |
| March | 24 · 139 t | 27 · 180 t | 33 · 194 t | 53 · 312 t |
| April | 29 · 172 t | 38 · 291 t | 47 · 275 t | 65 · 367 t |
| May | 38 · 237 t | 48 · 385 t | 59 · 377 t | 85 · 525 t |
| June | 45 · 279 t | 62 · 456 t | 75 · 445 t | 98 · 628 t |
| July | 59 · 322 t | 73 · 502 t | 91 · 574 t | 116 · 745 t |
| August | 66 · 369 t | 85 · 549 t | 109 · 674 t | 138 · 890 t |
| September | 76 · 402 t | 96 · 618 t | 125 · 779 t | 161 · 1,063 t |
| October | 85 · 477 t | 107 · 673 t | 148 · 905 t | 178 · 1,222 t |
| November | 98 · 537 t | 123 · 727 t | 168 · 1,038 t | 194 · 1,368 t |
| December | 114 · 601 t | 146 · 835 t | 186 · 1,108 t | 223 · 1,522 t |
Busiest rockets in 2023
Launches and payload by country in 2023
Orbital launch attempts by country, 2023
By the country of the rocket.
Show as table
| Country | Launches | Share | Payload to orbit | Share |
|---|---|---|---|---|
| United States | 116 | 52% | 1,265 t | 83% |
| China | 67 | 30% | 139 t | 9% |
| Russia | 19 | 9% | 84 t | 5% |
| India | 7 | 3% | 14 t | 1% |
| Japan | 3 | 1% | 6 t | <1% |
| North Korea | 3 | 1% | 200 kg | <1% |
| France | 2 | 1% | 13 t | 1% |
| Iran | 2 | 1% | 15 kg | <1% |
| South Korea | 2 | 1% | 316 kg | <1% |
| Israel | 1 | <1% | 300 kg | <1% |
| Italy | 1 | <1% | 783 kg | <1% |