

2011 Rocket Launch Statistics
In 2011, there were 84 orbital launch attempts worldwide, and 78 of them reached orbit. That is 10 more than in 2010. By country, Russia launched 35 and China 19. Together they put 429 tonnes of payload in orbit.
Statistics summary
Payload to orbit
2011
429 t
vs 387 t in 2010
Per week
8 t
vs 7 t in 2010
Reached orbit
2011
93%
78 of 84; 4 failures, 2 partial
2010
95%
70 of 74; 4 failures
Who flew in 2011
Company2011 launches2011Share
 Progress RSC19vs 1323%
 CASC19vs 1523%
 ULA11vs 713%
- Khrunichev10vs 1412%
- Yuzhmash6vs 37%
 ArianeGroup5vs 66%
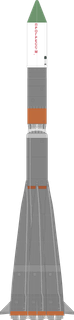
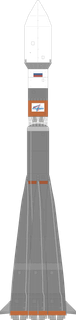
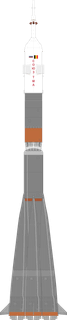
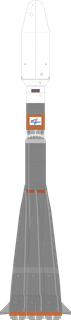
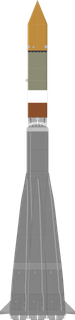
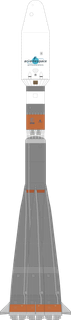
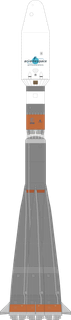










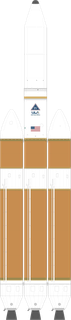

















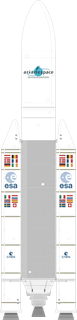
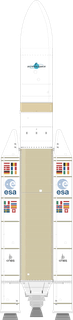
2011 against 2010. Drawings at one true scale.
Country2011 launches2011Share

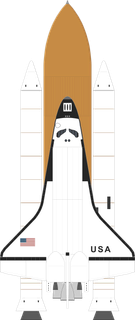









2011 against 2010. Drawings at one true scale.
Every company, as a table
| Company | Launches | Share | Payload to orbit | Share |
|---|---|---|---|---|
| CASC | 19 | 23% | 61 t | 14% |
| Progress RSC | 19 | 23% | 93 t | 22% |
| ULA | 11 | 13% | 42 t | 10% |
| Khrunichev | 10 | 12% | 51 t | 12% |
| Yuzhmash | 6 | 7% | 16 t | 4% |
| ArianeGroup | 5 | 6% | 62 t | 14% |
| ISRO | 3 | 4% | 4 t | 1% |
| Mitsubishi Heavy Industries | 3 | 4% | 24 t | 6% |
| Rockwell / Martin Marietta / Thiokol | 3 | 4% | 75 t | 18% |
| Orbital ATK | 2 | 2% | 460 kg | <1% |
| Orbital Sciences | 2 | 2% | 710 kg | <1% |
| Iranian Space Agency | 1 | 1% | 13 kg | <1% |
Launches and payload by week

Orbital launch attempts per week, 2011
SpaceX, and the rest of the world by region.
Show as table
| Week of | SpaceX | Rest of US | Europe | China | Russia | India | Rest of World | All | Payload to orbit |
|---|---|---|---|---|---|---|---|---|---|
| 25 Dec 2011 | – | – | – | – | 1 | – | – | 1 | 4 t |
| 18 Dec 2011 | – | – | – | 2 | 2 | – | – | 4 | 14 t |
| 11 Dec 2011 | – | – | – | – | 2 | – | 1 | 3 | 8 t |
| 27 Nov 2011 | – | – | – | 2 | 1 | – | – | 3 | 6 t |
| 20 Nov 2011 | – | 1 | – | 1 | 1 | – | – | 3 | 9 t |
| 13 Nov 2011 | – | – | – | – | 1 | – | – | 1 | 7 t |
| 6 Nov 2011 | – | – | – | 1 | 1 | – | – | 2 | 5 t |
| 30 Oct 2011 | – | – | – | 1 | 2 | – | – | 3 | 22 t |
| 23 Oct 2011 | – | 1 | – | – | – | – | – | 1 | 2 t |
| 16 Oct 2011 | – | – | – | – | 2 | – | – | 2 | 9 t |
| 9 Oct 2011 | – | – | – | – | – | 1 | – | 1 | 1 t |
| 2 Oct 2011 | – | – | – | 1 | 2 | – | – | 3 | 10 t |
| 25 Sep 2011 | – | 1 | – | 1 | 1 | – | – | 3 | 15 t |
| 18 Sep 2011 | – | – | 1 | 1 | 2 | – | 1 | 5 | 23 t |
| 4 Sep 2011 | – | 1 | – | – | – | – | – | 1 | 614 kg |
| 21 Aug 2011 | – | – | – | – | 1 | – | – | 1 | – |
| 14 Aug 2011 | – | – | – | 2 | 2 | – | – | 4 | 9 t |
| 7 Aug 2011 | – | – | – | 1 | – | – | – | 1 | 5 t |
| 31 Jul 2011 | – | 1 | 1 | – | – | – | – | 2 | 12 t |
| 24 Jul 2011 | – | – | – | 2 | – | – | – | 2 | 3 t |
| 17 Jul 2011 | – | – | – | – | 1 | – | – | 1 | 4 t |
| 10 Jul 2011 | – | 1 | – | 1 | 2 | 1 | – | 5 | 15 t |
| 3 Jul 2011 | – | 1 | – | 1 | – | – | – | 2 | 30 t |
| 26 Jun 2011 | – | 1 | – | – | 1 | – | – | 2 | 7 t |
| 19 Jun 2011 | – | – | – | 1 | 1 | – | – | 2 | 15 t |
| 12 Jun 2011 | – | – | – | – | – | – | 1 | 1 | 13 kg |
| 5 Jun 2011 | – | 1 | – | – | 1 | – | – | 2 | 8 t |
| 15 May 2011 | – | 1 | 1 | – | 1 | – | – | 3 | 36 t |
| 1 May 2011 | – | 1 | – | – | 1 | – | – | 2 | 7 t |
| 24 Apr 2011 | – | – | – | – | 1 | – | – | 1 | 10 t |
| 17 Apr 2011 | – | – | 1 | – | – | 1 | – | 2 | 11 t |
| 10 Apr 2011 | – | 1 | – | – | – | – | – | 1 | 2 t |
| 3 Apr 2011 | – | – | – | 1 | 1 | – | – | 2 | 10 t |
| 6 Mar 2011 | – | 1 | – | – | – | – | – | 1 | 3 t |
| 27 Feb 2011 | – | 2 | – | – | – | – | – | 2 | 5 t |
| 20 Feb 2011 | – | 1 | – | – | 1 | – | – | 2 | 25 t |
| 13 Feb 2011 | – | – | 1 | – | – | – | – | 1 | 27 t |
| 6 Feb 2011 | – | 1 | – | – | – | – | – | 1 | 235 kg |
| 30 Jan 2011 | – | – | – | – | 1 | – | – | 1 | 900 kg |
| 23 Jan 2011 | – | – | – | – | 1 | – | – | 1 | 10 t |
| 16 Jan 2011 | – | 1 | – | – | 1 | – | 1 | 3 | 37 t |
Year against year
Orbital launch attempts, year against year, 2008 to 2011
Added up through each year.
Show as table
| By the end of | 2008 | 2009 | 2010 | 2011 |
|---|---|---|---|---|
| January | 3 · 9 t | 3 · 9 t | 2 · 7 t | 4 · 47 t |
| February | 7 · 46 t | 11 · 40 t | 6 · 57 t | 9 · 100 t |
| March | 14 · 114 t | 16 · 83 t | 10 · 74 t | 12 · 108 t |
| April | 22 · 141 t | 24 · 111 t | 19 · 140 t | 18 · 141 t |
| May | 27 · 191 t | 32 · 156 t | 23 · 179 t | 23 · 183 t |
| June | 33 · 212 t | 36 · 171 t | 35 · 220 t | 30 · 214 t |
| July | 37 · 234 t | 43 · 216 t | 38 · 230 t | 40 · 266 t |
| August | 42 · 249 t | 49 · 266 t | 42 · 245 t | 48 · 292 t |
| September | 50 · 285 t | 56 · 309 t | 51 · 281 t | 57 · 331 t |
| October | 57 · 303 t | 61 · 340 t | 59 · 324 t | 66 · 371 t |
| November | 62 · 358 t | 70 · 397 t | 67 · 353 t | 75 · 400 t |
| December | 69 · 386 t | 78 · 429 t | 74 · 387 t | 84 · 429 t |
Busiest rockets in 2011
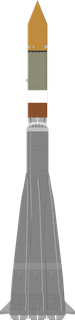
Launches and payload by country in 2011
Orbital launch attempts by country, 2011
By the country of the rocket.