

2006 Rocket Launch Statistics
In 2006, there were 66 orbital launch attempts worldwide, and 62 of them reached orbit. That is 10 more than in 2005. SpaceX flew 1 of them (2%); by country, Russia launched 29 and the United States 18. Together they put 315 tonnes of payload in orbit.
Statistics summary
Payload to orbit
2006
315 t
vs 254 t in 2005
Per week
6 t
vs 5 t in 2005
Reached orbit
2006
94%
62 of 66; 3 failures, 1 partial
2005
93%
52 of 56; 4 failures
Who flew in 2006
Company2006 launches2006Share

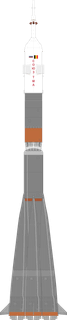
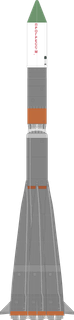
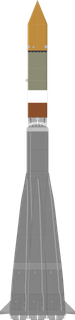
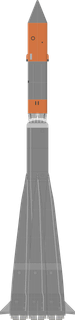
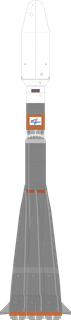
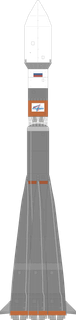






















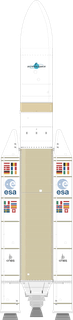
2006 against 2005. Drawings at one true scale.
Country2006 launches2006Share



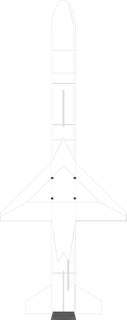



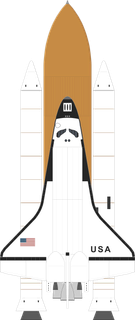







2006 against 2005. Drawings at one true scale.
Every company, as a table
| Company | Launches | Share | Payload to orbit | Share |
|---|---|---|---|---|
| Progress RSC | 12 | 18% | 74 t | 23% |
| ULA | 10 | 15% | 24 t | 8% |
| Yuzhmash | 8 | 12% | 28 t | 9% |
| Khrunichev | 7 | 11% | 27 t | 9% |
| CASC | 6 | 9% | 15 t | 5% |
| ArianeGroup | 5 | 8% | 41 t | 13% |
| Mitsubishi Heavy Industries | 4 | 6% | 16 t | 5% |
| Orbital Sciences | 3 | 5% | 860 kg | <1% |
| Rockwell / Martin Marietta / Thiokol | 3 | 5% | 84 t | 27% |
| IHI Aerospace | 2 | 3% | 2 t | 1% |
| ISRO | 1 | 2% | – | |
| KB Mashinostroyeniya | 1 | 2% | 175 kg | <1% |
| McDonnell Douglas | 1 | 2% | 2 t | 1% |
| Moscow Institute of Thermal Technology | 1 | 2% | 290 kg | <1% |
| Polyot | 1 | 2% | 770 kg | <1% |
| SpaceX | 1 | 2% | – |
Launches and payload by week

Orbital launch attempts per week, 2006
SpaceX, and the rest of the world by region.
Show as table
| Week of | SpaceX | Rest of US | Europe | China | Russia | India | Rest of World | All | Payload to orbit |
|---|---|---|---|---|---|---|---|---|---|
| 24 Dec 2006 | – | – | – | – | 3 | – | – | 3 | 8 t |
| 17 Dec 2006 | – | – | – | – | 1 | – | 1 | 2 | 7 t |
| 10 Dec 2006 | – | 3 | – | – | 1 | – | – | 4 | 30 t |
| 3 Dec 2006 | – | – | 1 | 1 | – | – | – | 2 | 9 t |
| 12 Nov 2006 | – | 1 | – | – | – | – | – | 1 | 2 t |
| 5 Nov 2006 | – | – | – | – | 1 | – | – | 1 | 4 t |
| 29 Oct 2006 | – | 1 | – | – | 1 | – | – | 2 | 6 t |
| 22 Oct 2006 | – | 1 | – | 2 | 1 | – | – | 4 | 17 t |
| 15 Oct 2006 | – | – | – | – | 1 | – | – | 1 | 4 t |
| 8 Oct 2006 | – | – | 1 | – | – | – | – | 1 | 8 t |
| 24 Sep 2006 | – | 1 | – | – | – | – | – | 1 | 2 t |
| 17 Sep 2006 | – | – | – | – | 1 | – | 1 | 2 | 8 t |
| 10 Sep 2006 | – | – | – | 1 | 1 | – | 1 | 3 | 11 t |
| 3 Sep 2006 | – | 1 | – | 1 | – | – | – | 2 | 38 t |
| 20 Aug 2006 | – | – | – | – | 1 | – | – | 1 | 4 t |
| 6 Aug 2006 | – | – | 1 | – | – | – | – | 1 | 8 t |
| 30 Jul 2006 | – | – | – | – | 1 | – | – | 1 | 6 t |
| 23 Jul 2006 | – | – | – | – | 2 | – | – | 2 | 765 kg |
| 16 Jul 2006 | – | – | – | – | 1 | – | – | 1 | 2 t |
| 9 Jul 2006 | – | – | – | – | 1 | 1 | – | 2 | 1 t |
| 2 Jul 2006 | – | 1 | – | – | – | – | – | 1 | 26 t |
| 25 Jun 2006 | – | 1 | – | – | 1 | – | – | 2 | 8 t |
| 18 Jun 2006 | – | 1 | – | – | 2 | – | – | 3 | 16 t |
| 11 Jun 2006 | – | – | – | – | 2 | – | – | 2 | 8 t |
| 21 May 2006 | – | 1 | 1 | – | 1 | – | – | 3 | 12 t |
| 30 Apr 2006 | – | – | – | – | 1 | – | – | 1 | 7 t |
| 23 Apr 2006 | – | 1 | – | 1 | 2 | – | – | 4 | 14 t |
| 16 Apr 2006 | – | 1 | – | – | – | – | – | 1 | 4 t |
| 9 Apr 2006 | – | 1 | – | – | 1 | – | – | 2 | 5 t |
| 26 Mar 2006 | – | – | – | – | 1 | – | – | 1 | 7 t |
| 19 Mar 2006 | 1 | 1 | – | – | – | – | – | 2 | 115 kg |
| 5 Mar 2006 | – | – | 1 | – | – | – | – | 1 | 8 t |
| 26 Feb 2006 | – | – | – | – | 1 | – | – | 1 | 3 t |
| 19 Feb 2006 | – | – | – | – | – | – | 1 | 1 | 966 kg |
| 12 Feb 2006 | – | – | – | – | 1 | – | 1 | 2 | 9 t |
| 22 Jan 2006 | – | – | – | – | – | – | 1 | 1 | 4 t |
| 15 Jan 2006 | – | 1 | – | – | – | – | – | 1 | 3 t |
Year against year
Orbital launch attempts, year against year, 2003 to 2006
Added up through each year.
Show as table
| By the end of | 2003 | 2004 | 2005 | 2006 |
|---|---|---|---|---|
| January | 5 · 19 t | 2 · 14 t | 2 · 2 t | 2 · 7 t |
| February | 7 · 33 t | 5 · 21 t | 7 · 30 t | 6 · 20 t |
| March | 10 · 39 t | 10 · 39 t | 10 · 44 t | 10 · 35 t |
| April | 17 · 66 t | 15 · 56 t | 16 · 72 t | 17 · 59 t |
| May | 21 · 74 t | 20 · 78 t | 20 · 86 t | 21 · 78 t |
| June | 31 · 105 t | 25 · 95 t | 26 · 105 t | 28 · 110 t |
| July | 33 · 111 t | 29 · 105 t | 29 · 135 t | 34 · 141 t |
| August | 40 · 136 t | 34 · 127 t | 36 · 152 t | 37 · 159 t |
| September | 44 · 147 t | 40 · 140 t | 41 · 176 t | 45 · 219 t |
| October | 51 · 171 t | 44 · 157 t | 47 · 211 t | 52 · 254 t |
| November | 55 · 180 t | 48 · 163 t | 50 · 227 t | 55 · 262 t |
| December | 63 · 199 t | 54 · 195 t | 56 · 254 t | 66 · 315 t |
Busiest rockets in 2006

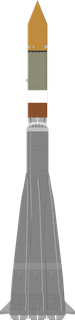
Launches and payload by country in 2006
Orbital launch attempts by country, 2006
By the country of the rocket.